The headline
The strongest investor scores in our 1 August 2026 snapshot are not in London, Manchester city centre or the usual commuter-belt names. The top 20 are concentrated in Cumbria, the North East, South Yorkshire, Liverpool and Wales.
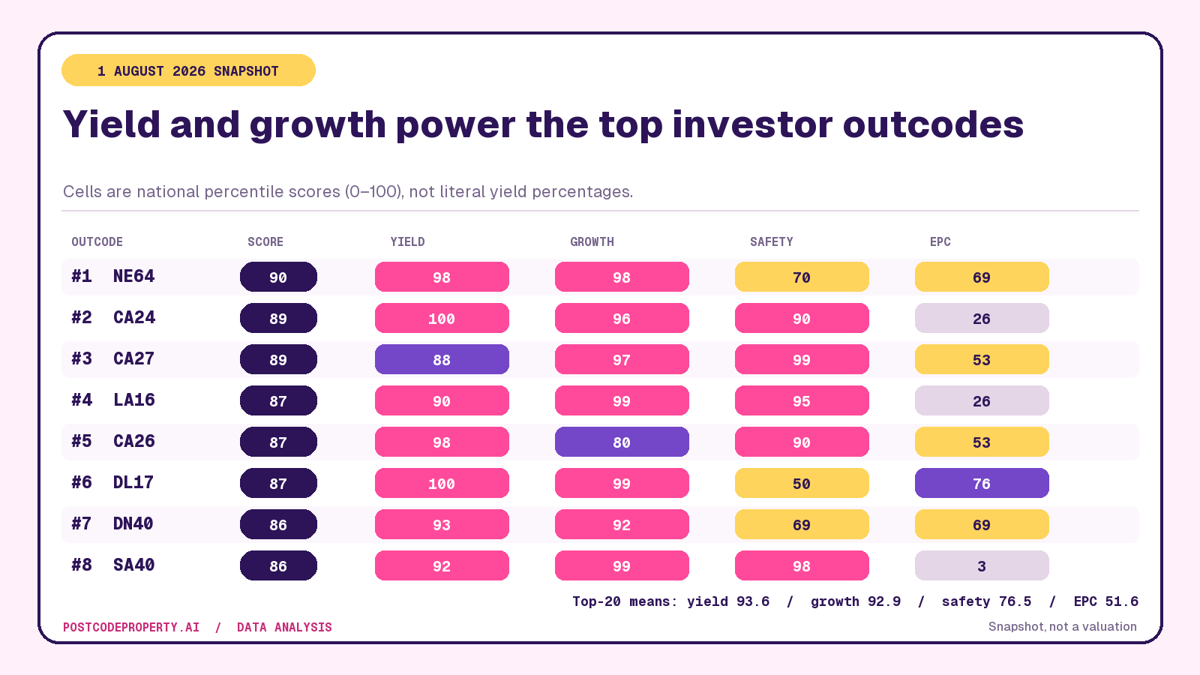
Across those 20 outcodes, the mean percentile scores were 93.6 for rental yield, 92.9 for five-year price growth, 76.5 for safety and only 51.6 for EPC performance. In other words, the list is powered by the combination of low entry prices and past growth. Energy efficiency is much less consistent.
First, what these numbers mean
Every active outcode is scored against its peers. The four investor signals are weighted:
The values in the chart are percentile positions from 0 to 100, not literal percentages. A yield score of 98 means the outcode ranks above roughly 98% of scored peers for estimated gross yield; it does not mean a 98% rental return.
An outcode must have at least half of the persona's weighted evidence available to rank. In the latest canary, every investor top-20 area had at least three of the four signals, and yield, growth and EPC each populated for more than 99% of the sampled investor outcodes. Crime populated for 84%, with known force-level publication gaps excluded rather than treated as zero crime.
The top 20 snapshot
Affordability is doing more work than the headline score shows
Affordability is not a separate investor weight, but it feeds the yield calculation. A given annual rent becomes a much stronger gross yield when the purchase price is low.
The five-year outcode medians in the same production snapshot include roughly £86,000 in DL17, £98,000 in NP24, £115,000 in both L28 and CF45, £121,000 in NE64 and £123,650 in CA26. Those are area medians across mixed property types, not asking-price targets, but they explain the map better than a story about newly fashionable cities would.
The geography also shows why a national league table needs sample-size context. S63 has about 2,900 sales in the five-year aggregate, while CA24 has 74. Both can rank, but the Barnsley signal is supported by a much deeper market. Thin areas deserve a wider confidence interval even when their percentile score is excellent.
The surprise is the energy split
Some top outcodes combine strong market signals with a high EPC percentile: SP9 scores 95, L27 94, L11 93 and TS27 91. Others sit at the opposite extreme: LL44 scores 1, SA40 3, LL60 7 and SA64 13.
That is not a minor footnote. A cheap, fast-growing market with inefficient stock can shift capital expenditure to the buyer. Boilers, glazing, insulation and ventilation can erase part of an apparent yield advantage, especially for landlords facing tightening efficiency standards.
The list therefore divides into two different propositions:
Treating both as the same “top 20” would miss the most practical difference between them.
What this ranking cannot tell you
It does not model mortgage rates, void periods, service charges, maintenance, local licensing, tax, insurance or the condition of a particular property. Rental yield is an area estimate rather than a tenancy guarantee. Five-year growth describes the past and can be distorted by the mix of homes sold in each period.
Most importantly, a percentile ranking is a shortlist generator, not financial advice. An outcode can score well while a specific street has flood exposure, weak demand for the property type you are buying, or a sale price that destroys the headline yield.
A better way to use the list
Data vintage and sources
See the full investor rankings and open any outcode for the underlying area report before drawing a conclusion.