The result that made us re-check the model
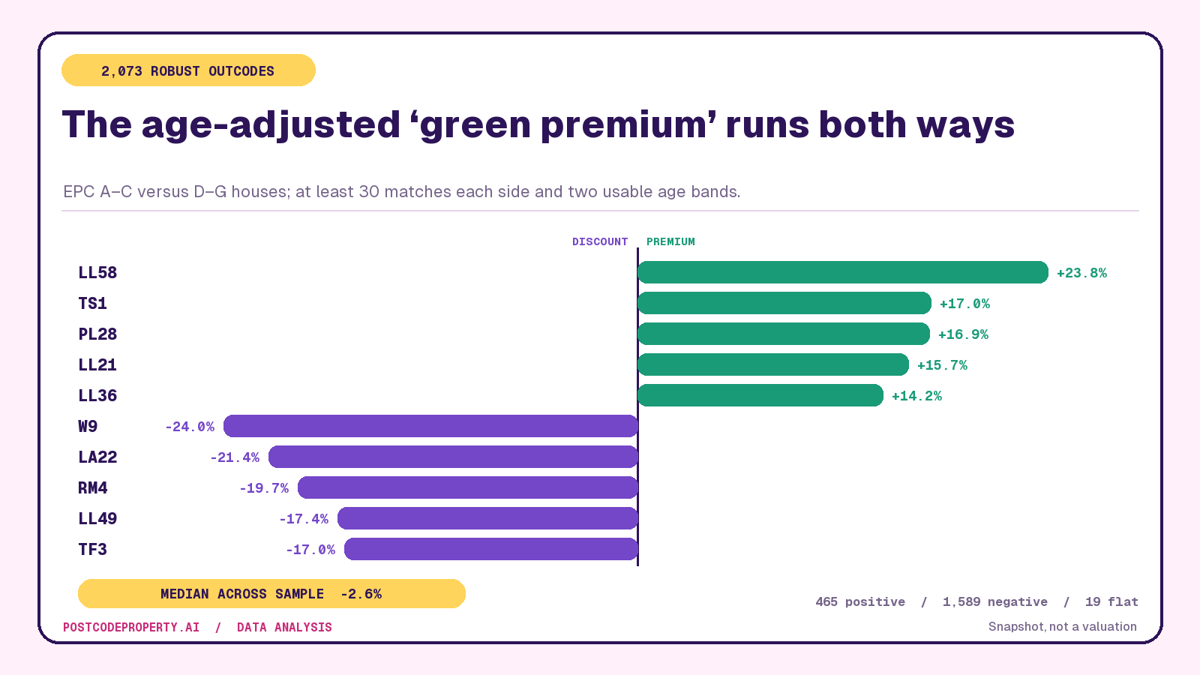
Among 2,073 outcodes with enough matched sales and EPC evidence, the median age-adjusted price difference between efficient and inefficient houses was -2.6%. Efficient homes had a positive adjusted premium in 465 outcodes, a negative result in 1,589, and a rounded zero in 19.
That means roughly 22.4% positive, 76.7% negative and 0.9% flat under this observational method. The range was wide: from +23.8% in LL58 to -24.0% in W9.
The conclusion is not that efficiency reduces a home's value. It is that a single national “green premium” is a poor description of local housing markets. Location, construction era, property mix, condition and unobserved quality still dominate many postcode-level comparisons.
What we measured
We joined five years of arm's-length HM Land Registry sales to EPC records using normalised address and postcode. We kept established detached, semi-detached and terraced houses, excluding new builds so their construction premium did not masquerade as an efficiency premium.
For every matched sale we calculated price per square metre from the EPC floor area, then divided homes into:
A raw postcode comparison is heavily confounded by age. Newer homes are usually more efficient, but period homes can sit on the best streets. We therefore compared efficient and inefficient homes within four construction-era bands:
An age band contributed only with at least five sales on both sides. For this article, an outcode also needed at least two usable age bands and at least 30 efficient and 30 inefficient house matches overall. The within-band differences were weighted by the smaller side of each comparison.
The strongest positive results
SW10 is a useful warning about raw averages. The unadjusted comparison says efficient houses are 2.6% cheaper per square metre. Once construction era is held more constant, the sign flips to +12.4%. The efficient stock is not simply “better”; it is distributed differently across age bands.
The strongest negative results
W9 and NW11 contain expensive period housing where character, plot, street and heritage can outweigh the capitalised value of a higher EPC. A buyer may willingly pay more per square metre for an inefficient period house in a premium micro-location than for an efficient home elsewhere in the same outcode.
The opposite reversal also happens. In M5, the raw comparison is +23.3%, but the age-adjusted result is -14.0%. Newer efficient homes make the unadjusted number look compelling; within comparable age bands, that apparent premium disappears.
Why a national average misleads
A national figure blends together several different effects:
Age adjustment removes one large confounder, not all of them. This remains descriptive evidence, not a causal estimate of the value created by installing insulation or replacing a boiler.
What buyers and landlords should take from it
Do not add a national green-premium percentage to a valuation. Check the local outcode, the same construction era and the same property type. Where the adjusted premium is positive, it can support the case for efficient stock, but it still does not prove a retrofit will earn the same return.
Where the result is negative, ask what the inefficient comparison group contains. It may be larger plots, heritage streets or scarce period houses. A negative result can identify a retrofit opportunity, but it can also identify buildings where visible alterations are constrained or expensive.
The practical calculation remains property-specific:
Data vintage and limitations
The official sources are HM Land Registry Price Paid Data and the MHCLG EPC data service. Read Understanding EPC ratings before treating any certificate as a precise forecast of energy use.