A council average can describe almost nobody
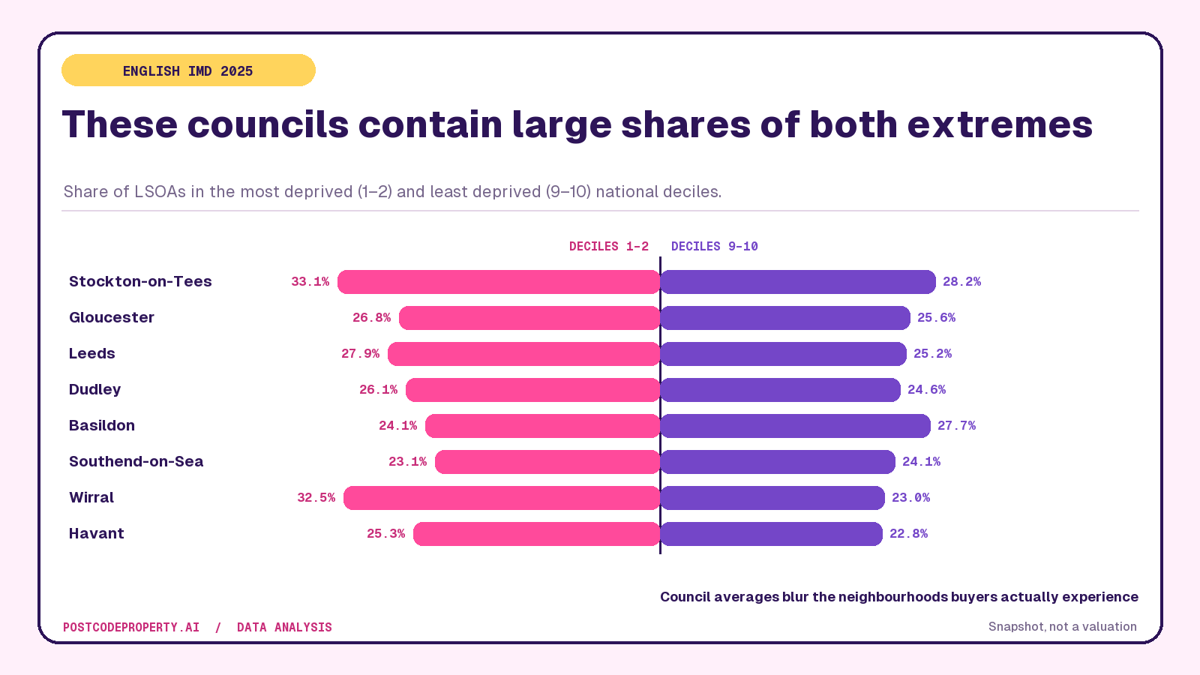
Stockton-on-Tees has 33.1% of its neighbourhoods in England's two most deprived deciles and 28.2% in the two least deprived. Gloucester is almost perfectly split: 26.8% at the more-deprived end and 25.6% at the less-deprived end. Leeds, despite its much larger scale, has 27.9% and 25.2% respectively.
Those places are not “average.” They are internally divided. A council-wide house price, crime rate or school statistic can combine sharply different neighbourhoods and produce a number that matches very few streets.
How we measured the divide
The English Indices of Deprivation 2025 ranks Lower-layer Super Output Areas, or LSOAs, across multiple domains including income, employment, education, health, crime, housing barriers and the living environment. An LSOA typically represents about 1,500 people.
For each local authority we calculated:
That final rule rewards councils with a meaningful share at both ends. A place with 60% in deciles 1–2 and 2% in deciles 9–10 is highly deprived, but not highly split by this definition. We required at least 30 LSOAs and at least 5% at each extreme.
The most balanced extremes
The metric is deliberately different from “most unequal” in an income-statistics sense. IMD is a relative, multidimensional area index, not a household income distribution. We are measuring how strongly both national extremes coexist inside one council boundary.
What creates the pattern
The councils on the list arrive there through different geographies.
Large urban authorities such as Leeds and Bristol contain affluent suburbs, expensive inner neighbourhoods, student districts, social housing estates and former industrial communities under one boundary. Scale gives them room to contain several housing markets at once.
Coastal and estuary authorities such as Southend, Wirral and Havant often combine high-value waterfront or commuter locations with neighbourhoods facing weaker employment access, health outcomes or housing pressure.
Post-industrial authorities such as Stockton and Dudley can place prosperous villages and low-deprivation suburban areas close to neighbourhoods shaped by industrial decline. The administrative boundary joins them; the lived housing market does not.
Northumberland is a different case again. Its 21%–21% split spans an enormous rural authority, where market towns, former mining communities, remote areas and wealthy coastal or commuter pockets are separated by long distances.
Why this matters in a property search
Property portals usually start with a town or council name. Data should quickly move down to the postcode, LSOA and street.
In a sharply divided authority:
This is not an argument to avoid deprived areas. IMD is not a judgement on residents or a forecast of house prices. It is an argument to reject lazy averages and inspect the domain-level evidence relevant to your decision.
The postcode can still hide variation
Moving from council to postcode improves precision, but it is not the final step. Outcodes can contain several LSOAs; full postcodes can straddle boundaries; crime locations are anonymised; school admission areas move; flood risk can change from one end of a road to the other.
A sensible hierarchy is:
The sharper the council's internal divide, the less weight you should place on step one.
Caveats
Source and next step
Source: MHCLG English Indices of Deprivation 2025, joined to the production postcode geography at LSOA level. The analysis uses all returned authorities meeting the size and two-sided-extreme rules above.
Use the deprivation-gradient ranking for the wider table, then open a free postcode report to move from the council average to the neighbourhood you are actually considering.